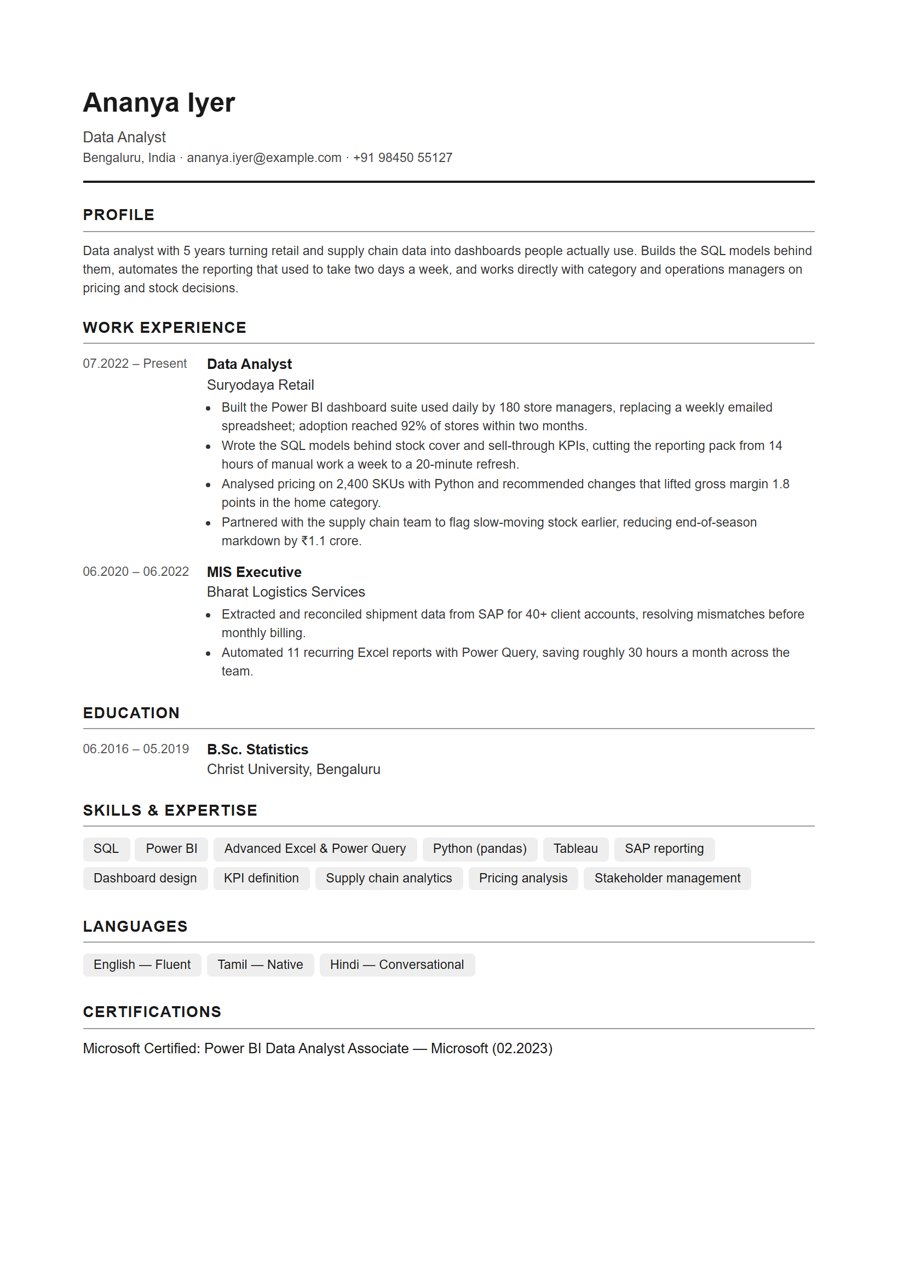
A one-page data analyst resume example built from 10 live postings — SQL, Power BI, dashboards and the numbers that make each bullet land.
Why this example works
Dashboards are the job, so they lead
"Dashboards" was the single most-mentioned term across the postings we sampled, ahead of SQL itself. The first bullet is a dashboard with an adoption number behind it, not a list of tools.
Every number is one a manager would recognise
180 store managers, 14 hours down to 20 minutes, 1.8 margin points, ₹1.1 crore of markdown avoided. An analyst who can quantify their own work is making the case that they can quantify anything else.
The tools appear where they were used
SQL, Power BI, Python and SAP each sit inside the bullet that describes what they produced, as well as in the skills list. A term that only appears in a skills list reads as a claim.
The earlier MIS role is kept, not hidden
Reporting and reconciliation work is where many analysts start in India, and it explains the SAP and Excel depth. Two bullets is the right amount of space for it.
Languages earn their place here
On an Indian or European resume a languages section is normal and useful. On a US resume it usually isn't, unless the job asks for it.
What data analyst postings actually ask for
We pulled 10 live postings (data analyst, India) on 24 September 2026 and counted what they mention — counted across all 10 descriptions, so a posting that repeats a term counts each time. The example above uses these terms where they are genuinely true of the person, which is the only way to use them.
| Term | Mentions across those postings |
|---|
| Dashboards | 14 |
| SQL | 11 |
| Power BI | 9 |
| Supply chain | 9 |
| SAP | 8 |
| Excel | 7 |
| KPIs | 6 |
| Python | 5 |
| Cross-functional work | 5 |
| Tableau | 4 |
| Reconciliation | 4 |
| Compliance / audit | 4 |
How those postings describe the work, in their own words:
- “develop and optimize complex SQL queries, including joins and common table expressions, for data extraction and transformation”
- “design and document new reporting solutions, including effort estimation and implementation planning”
- “collaborate with technical and business stakeholders to support operational and analytical data needs”
- “maintain reporting calendars, SOPs, and process documentation”
- “performs ongoing data quality monitoring and refinement”
Mistakes to avoid on a data analyst resume
Listing tools with no output attached
"SQL, Python, Power BI, Excel, Tableau" tells a hiring manager nothing about scale or difficulty. What did you build with them, and who used it?
Calling yourself data-driven
Every applicant for this role says it. The dashboards and the margin points say it better, and can be checked.
Hiding the business context
Analysts are hired to affect decisions. Naming the decision — pricing, stock cover, markdown — is what separates a report writer from an analyst.
A wall of certifications
One relevant, current certification helps. Six generic course completions push your experience further down the page.
Frequently asked questions
Do I need Python on a data analyst resume?+
Not always. SQL and a BI tool carry most analyst roles; Python appeared in half the postings we sampled and is what separates senior analyst listings. Include it if you genuinely use it.
Should a fresher's data analyst resume look like this?+
No — with no full-time experience, projects take the place of the experience section. See our <a href="/resume-examples">fresher examples</a> for that shape.
Is it worth adding dashboard screenshots?+
Not on the resume: images don't parse, and confidential company data shouldn't leave the company. Link a portfolio or a public sample project instead.
Should I write ₹ amounts or convert them?+
Use the currency of the job you're applying to. A rupee figure is right for an Indian employer; for an overseas application, convert it or express it as a percentage.
How technical should the summary be?+
Enough to place you: the domain, the tools, and what you change with them. Save architecture detail for the interview.
Read next